Note: This project was something I originally started early 2019 and haven’t really revisited. I’m keeping it up because I found it pretty neat, and perhaps will get around to adding more.
Study in Selected Temperature Records
The NOAA is a treasure trove of data, collecting observations daily of temperature, precipitation, and other assorted details at hundreds (thousands?) of sites throughout the United States.
Their records go back into 1800’s, with some stations keeping continuous records for well in excess of a century. This data is freely available upon request.
(https://www.ncdc.noaa.gov/cdo-web/)
Rising average global temperatures are old news, but with such detail available at so many different locations I was curious to see if there were any more subtle trends worth considering as we prepare for the challenges ahead.
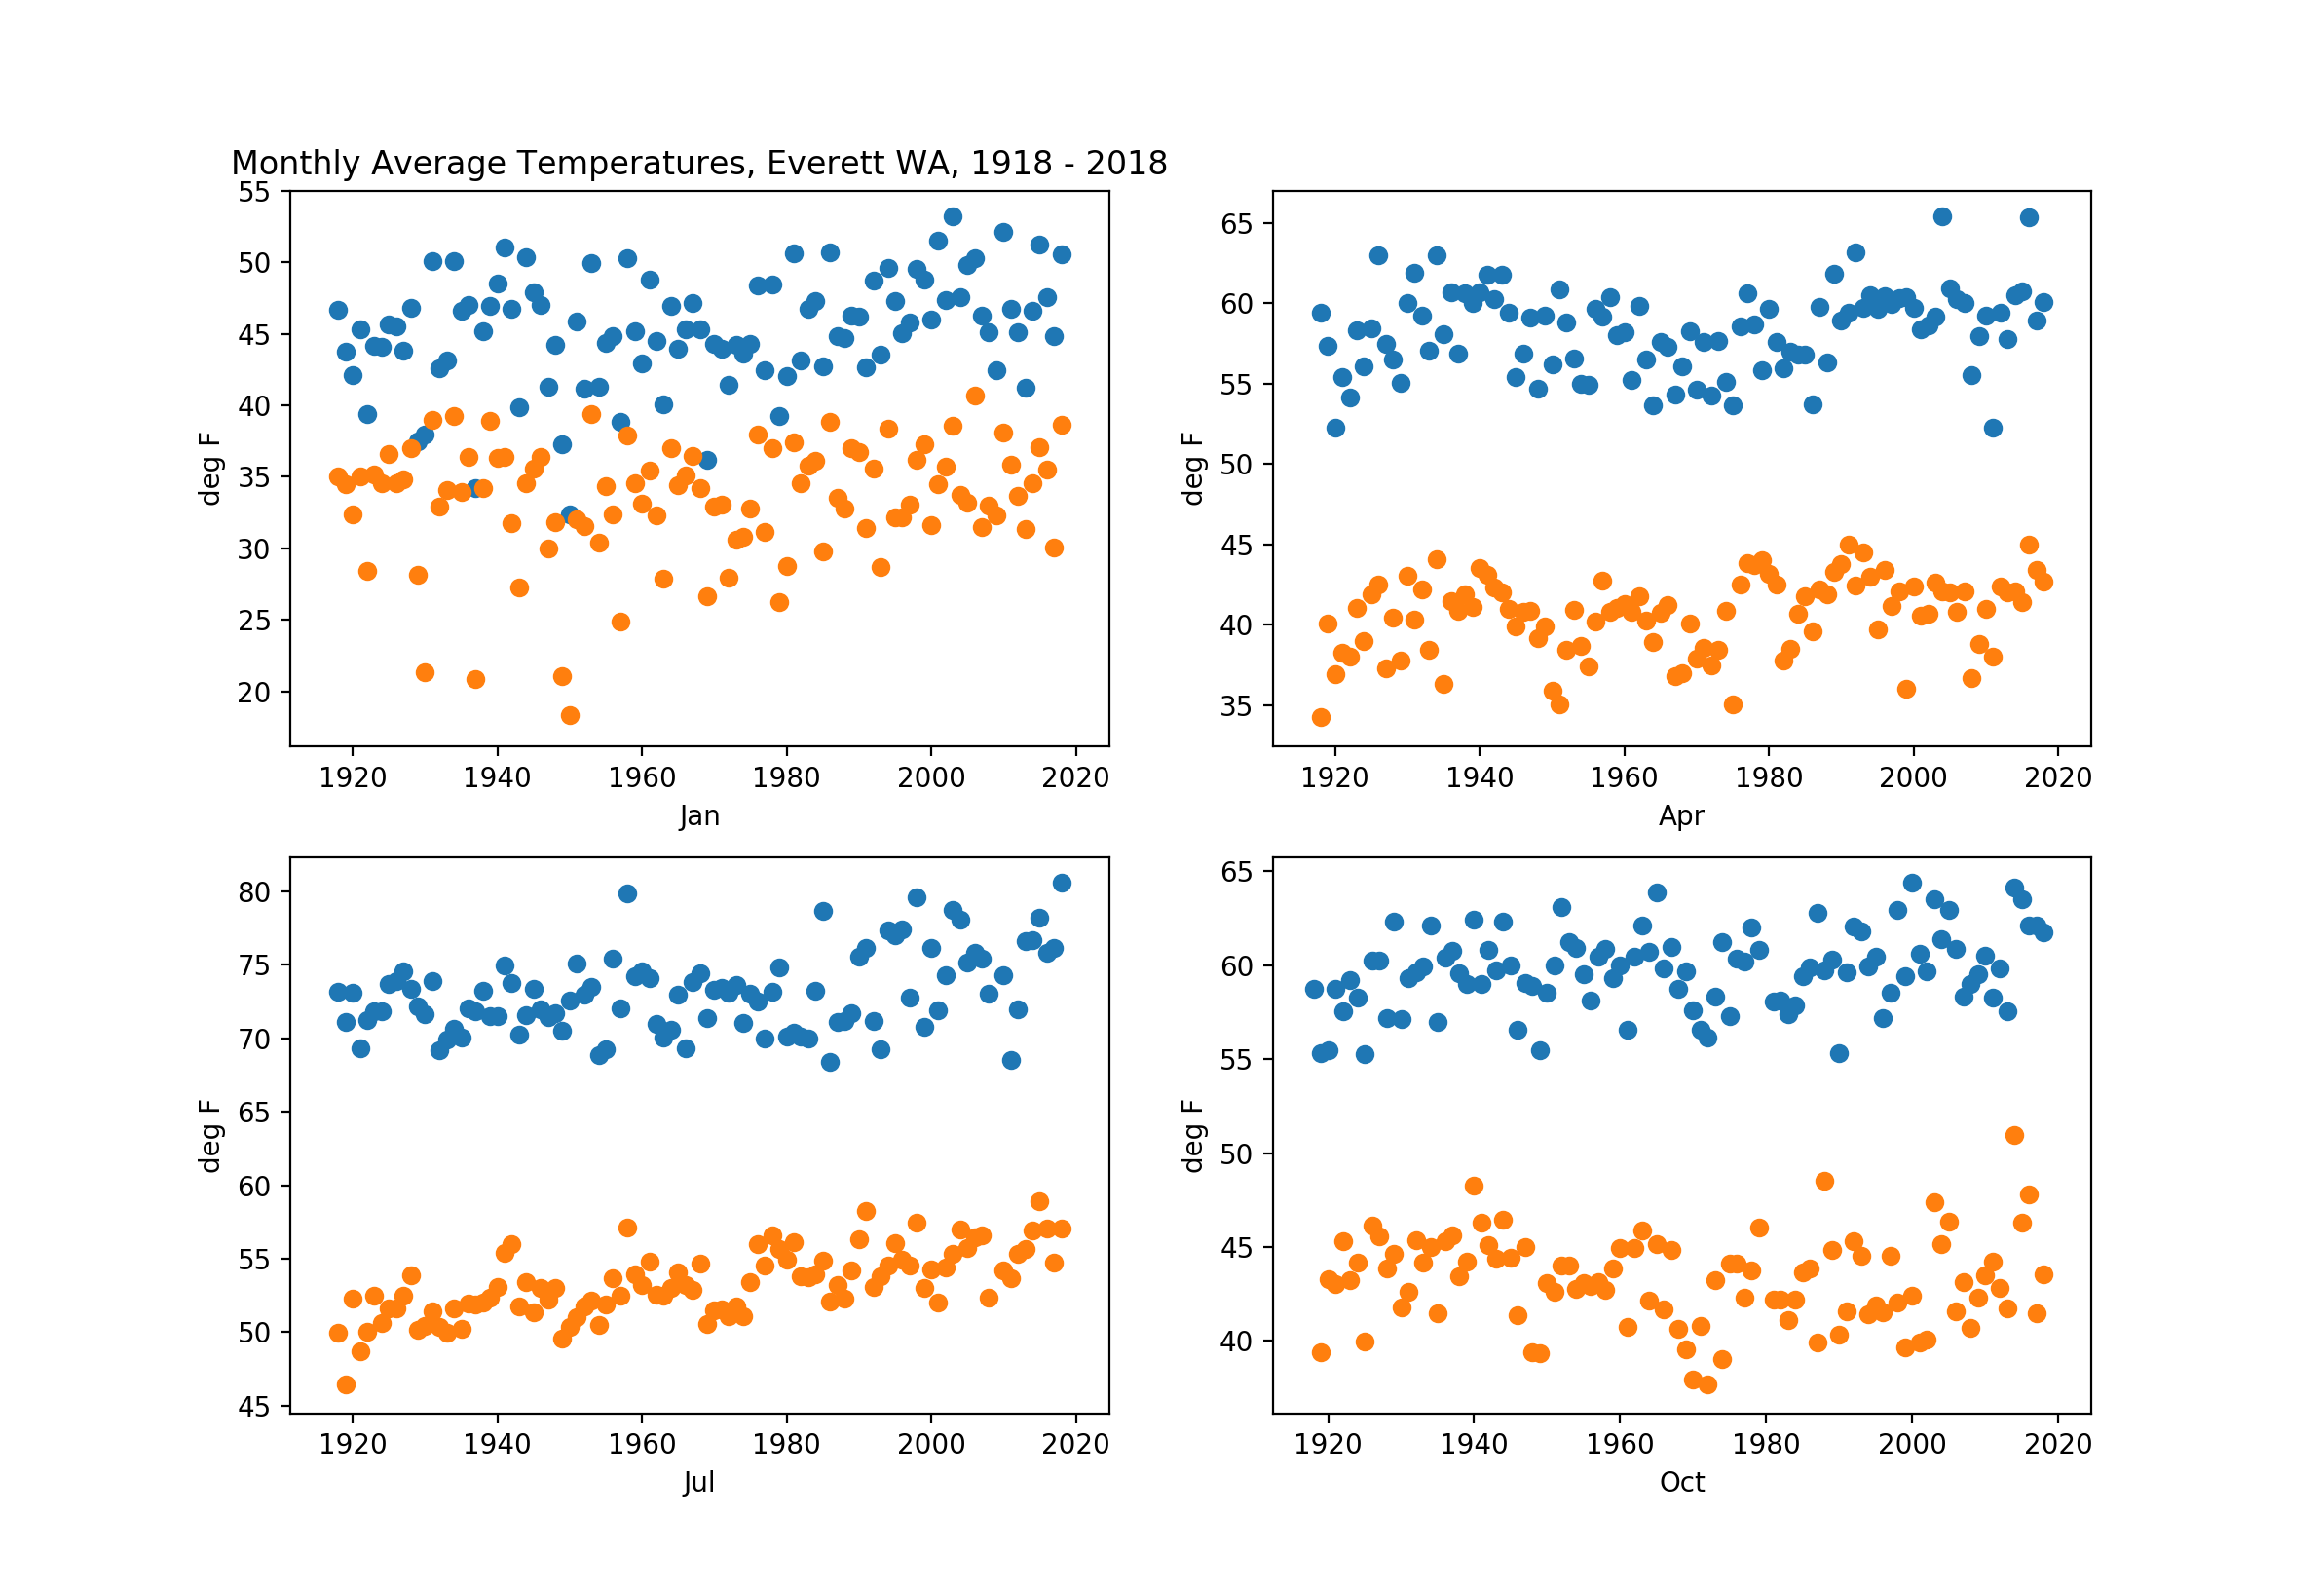
Two immediate ideas I had were to examine the temperature differences within each day (daily high temperatures minus that day’s low), and the temperature variation within each month.
Naively as a chemist I suspect I may see a significant decrease in the daily temperature spread. As average temperatures increase more water would shift into vapor, which will retain more heat overnight as the sun goes down so the air would cool more slowly, reflected in daily lows that increase faster than daily highs.
I searched for stations with at least a hundred years of continuous observations going back from present day, and from those chose four geographically disparate sites to request data for.
Currently I find myself with an excess of ambition. Tune in next week for the exciting results!
